Explore ways to bring everyday statistics to life
Jim Pumarlo
Jun 1, 2025


Statistics are a fact of life in everyday news. Cities release annual reports on building permits and police calls. Schools compare graduation rates and test scores with statewide results. Counties preview road projects for the construction season.
Newsrooms face a new stream of statistics with the flurry of executive actions under the Trump Administration. Federal programs are being reshaped or eliminated. Economic uncertainty is heightened with the on-again/off-again tariff policies. The ripple effects are being felt across public and private sectors.
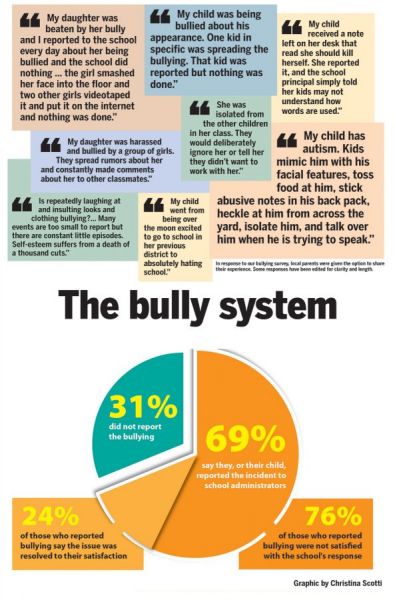
Reporters are tasked with analyzing local impacts. It’s important to present numbers in an easy-to-understand fashion. Simple graphics can highlight the data at a glance. The final step is to put faces behind the numbers. Statistics ring hollow without providing interpretation and context.
International trade is at the forefront in national headlines with the exchange on tariff policies. Ongoing negotiations present numerous opportunities to bring the actions in Washington, D.C., to your community and to examine the reality of the worldwide economy in which we live.
How important are exports to merchandise carried by local businesses? Are retail shelves empty of routine products? Are prices rising?
How dependent are local manufacturers on international trade — both in terms of securing materials to produce their goods and in sales to foreign markets? If costs are increasing, how are they weathering the storm? Is local employment being affected?
Profile local companies that face international competition. Who are the winners and losers in international trade negotiations and pacts?
Overall, what’s the talk in your town — at the coffee shop, dinner table and workplace? Are merchants seeing a decline in sales? Are people more careful with spending, holding back on major expenditures?
Expand the list of ideas with a brainstorming session.
Federal and state agencies release a variety of economic statistics. Consider identifying a handful and regularly publish them in a simple graphic. Select those where you can compare local numbers with state and/or national numbers; list comparable figures from a year ago. Then analyze the data for a potential accompanying story; put faces behind the statistics.
HERE IS ONE NEWSPAPER’S “ECONOMIC SNAPSHOT”
Examples include consumer price index (U.S. Bureau of Labor Statistics); gasoline prices (AAA); jobless rates, claims filed for unemployment insurance, employment by industry sector (appropriate state agencies); commercial air passengers; single-family home sales, average home sale price (Realtors associations); single-family home construction permits issued (city, county); net hotel-motel tax collections and net sales-tax collections (city finance departments).
Exploring stories behind statistics should be a regular exercise in newsrooms. Numerous examples can be found in everyday reporting.
The school board pitches a referendum for a new school. Calculate the tax increase for a factory, a Main Street retail store, a cabin on the outskirts of town, and homes of varying values. Present the numbers in a graphic, then talk to representative owners for reactions to the proposal.
The police blotter reports a rash of break-ins and thefts in a neighborhood. The police announce a crackdown with extra patrols. Prepare a graphic with the numbers. Take a pulse of the city’s efforts by talking with neighbors.
Annual reports are routinely presented by local government bodies ranging from a wrap-up of parent advisory council activities to building permits to public safety. Identify the most compelling statistics. Highlight those in a story, accompanied by a sidebar/graphic with the overall facts and figures. The package could well generate follow-up coverage.
You don’t have to wait for official reports. Brainstorm other ways to bring statistics to life.
Do a feature package on neighborhood activities for National Night Out. Incorporate a sidebar and graphic highlighting appropriate public safety statistics pointing out where the community is doing well and where it has work to do.
Does your community have a Habitat for Humanity program? The volunteers and host families are a natural story. Flesh out statistics to beef up the package. What is the available housing stock locally, and what is the average price? What is the menu of financing programs for first-time homebuyers?
Many communities honor volunteers of the year. Is there an umbrella organization that compiles the total number of volunteer hours contributed by businesses and civic organizations in a year? Which nonprofits are the greatest beneficiaries of volunteerism?
Round out your high school graduation story with accompanying statistics on a class’s cumulative academic achievements — specifically, what’s the grand total of post-secondary scholarships awarded to the graduates? Profile a handful of the more noteworthy recipients.
These and many other scenarios present opportunities to report statistics, but a recitation of numbers without interpretation offers little substance for readers. Stories are more vivid and meaningful when names and faces are attached. It’s a winning formula for your newspaper and your community.
Jim Pumarlo is former editor of the Red Wing (Minnesota) Republican Eagle. He writes, speaks and provides training on community newsroom success strategies. He is author of “Journalism Primer: A Guide to Community News Coverage,” “Votes and Quotes: A Guide to Outstanding Election Coverage” and “Bad News and Good Judgment: A Guide to Reporting on Sensitive Issues in Small-Town Newspapers.” He can be reached at www.pumarlo.com and welcomes comments and questions at jim@pumarlo.com.


